Bachelor Thesis - RuleTrends
Trend analysis and visualization of technical debt for continuous monitoring of code quality
Background
The term “technical debt” defines costs of additional work for refactoring or maintaining source code due to the fact that the code does not meet best practices.
While technical debt is temporarily acceptable in some situations, the debt should be paid back to keep the code maintainable. The effects of technical debt are not visible immediately, but at some point fixing small bugs or maintaining the code becomes extraordinarily more time consuming than it would be without technical debt.
To keep technical debt low, continuous monitoring is required. Static code analysis tools in combination with standardized methods like “Software Quality Assessment based on Lifecycle Expectations” (SQALE) provide a solution as they can be used to automatically calculate technical debt based on the identified non-conformities in the source code.
Topic Description
While it is possible to analyse trends regarding the overall technical debt of a project, it is still hard to apply corrective measures when having consolidated and aggregated values only. This is due to the lack of detailed information on how the overall technical debt is composed.
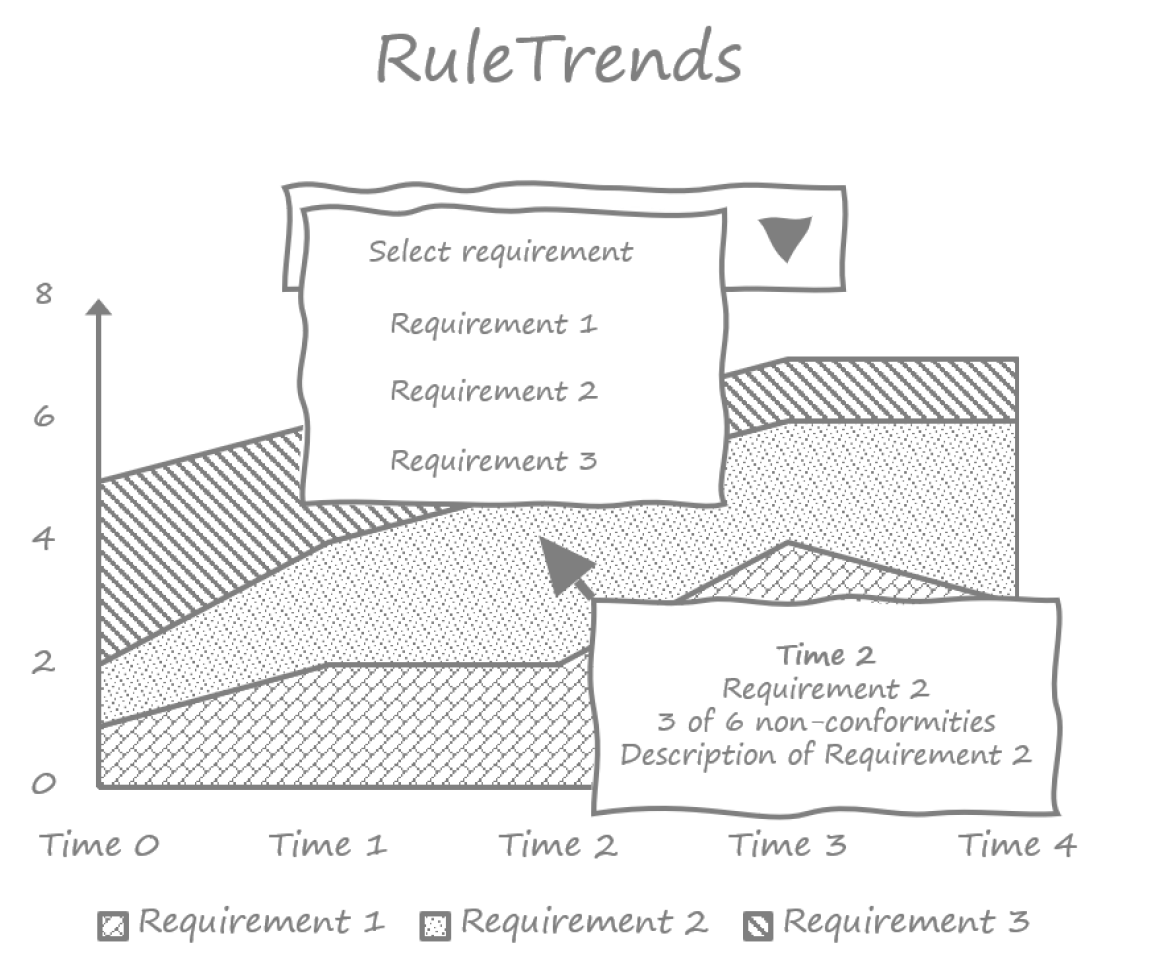
A visualization of the evolution of technical debt on a fine-grained rule-level should overcome this problem. For this, several requirements alongside possible realization options were defined, resulting in the following draft. The mockup shows a visualization with three types of non-conformities (Requirement 1 - 3), and allows for filtering for specific quality requirements. Additionally, the tooltip provides information on the currently hovered point in time.
Result
The concept was technically implemented on the example of SonarQube, a popular static code analysis tool.
The application of the developed plugin to a real project and the resulting visualisation looks as follows.
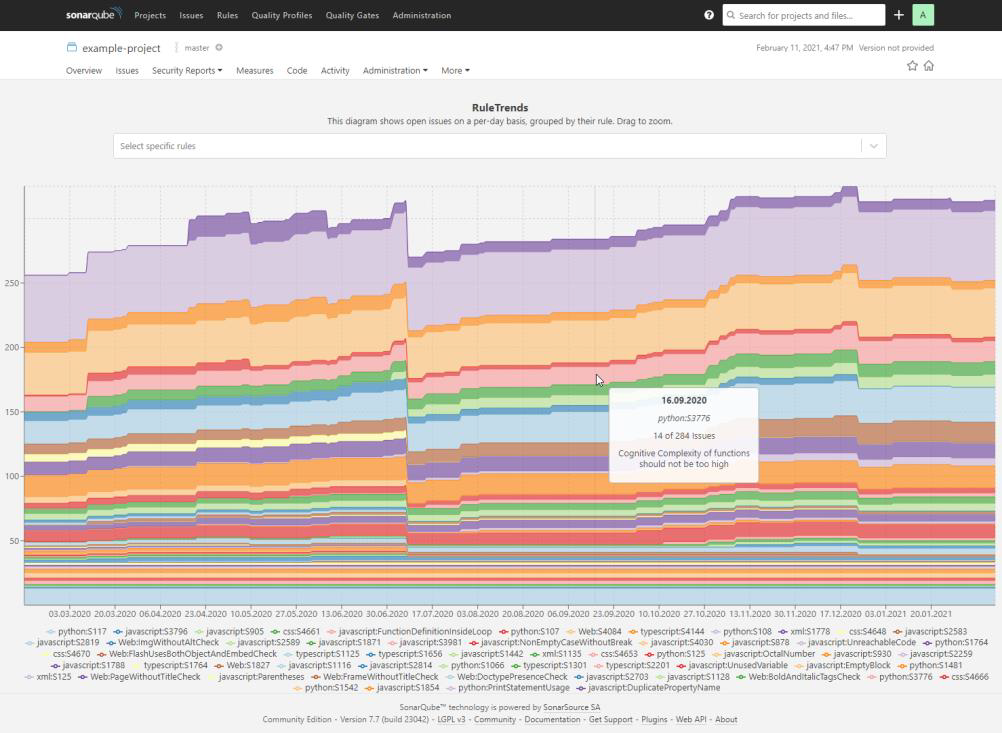
The default view allows to see both, overall and individual trends per rule over a time frame of one year. Filtering allows a better, more isolated identification of individual trends and zooming on the time-axis allows the analysis of local trends.
The source code of the plugin can be found here: RuleTrends Github Repository
Contact
If you are interested to participate in this project please contact peso@inso.tuwien.ac.at.